Three key factors to allow for stable detection of MSI
What is MSI?
Microsatellite (MS) generally refers to a repeat sequence composed of 1 to 6 nucleotides in tandem, and it is widely distributed in the genome. Microsatellite instability (MSI) refers to the phenomenon that, compared with normal tissues, microsatellite sites with deficient mismatch repair (dMMR) cause the accumulation of DNA replication errors, thereby resulting in changes in the length of repeat sequences. MSI is divided into three categories according to the degree: high microsatellite instability (MSI-high, MSI-H), low microsatellite instability (MSI-low, MSI-L), and microsatellite stability (MSS).
MSI and dMMR are important markers for tumor immunotherapy. The KEYNOTE-016 study suggests that dMMR/MSI-H can effectively predict whether patients with advanced solid tumors will benefit from the treatment of immune checkpoint inhibitors, regardless of specific cancer types. Among them, pembrolizumab, an immunotherapy drug, demonstrates an objective response rate of 40% in dMMR/MSI-H colorectal cancer, and an objective response rate of 71% in dMMR/MSI-H non-colorectal cancer types, both of which are higher than the objective response rate of 0% in colorectal cancer with normal MMR genes [1]. In 2017, the US FDA approved pembrolizumab for the treatment of patients with solid tumors with MSI-H/dMMR. According to the NCCN Guideline (Version 2021.2), MMR or MSI detection for patients with colorectal cancer can not only identify Lynch Syndrome, but also predict the response to immunotherapy for advanced metastatic colorectal cancer.
MSI Detection
Conventional MSI detection is mainly based on immunohistochemistry and fluorescent multiplex PCR (polymerase chain reaction) combined with capillary electrophoresis. In recent years, the advantages of MSI detection based on next-generation sequencing have become more and more obvious.
Immunohistochemistry (IHC)
IHC is used to detect the expression of four MMR proteins, MLH1, MSH2, MSH6 and PMS2, so as to determine the status of dMMR/MSI-H or proficient mismatch repair (pMMR)/MSI-L/MSS. The advantage of IHC is that it can directly identify the deficient genes, but the interpretation of each case is subjective, with a risk of misjudgment.
Fluorescent multiplex PCR combined with capillary electrophoresi
The method is the currently accepted "gold standard" for judging the microsatellite status by detecting the length distribution of several microsatellite sites. Taking the analysis of standard microsatellite sites proposed by the National Cancer Institute in 1997, BAT25, BAT26, D5S346, D2S123 and D17S250, as an example, changes in more than 2 microsatellite sites are interpreted as MSI-H; changes in a single microsatellite site are interpreted as MSI-L; no changes at any of the sites are interpreted as MSS.
Next-generation sequencing
Through the analysis of the sequencing results of a large number of microsatellite sites contained in the target region, software such as mSINGS [2] and msisensor [3] is used to calculate the microsatellite status. Compared with fluorescent multiplex PCR combined with capillary electrophoresis, the targeted capture data can be used for genotyping, the detection of driver mutations and structural variations, and MSI analysis, which can reduce the amount of samples and improve the efficiency of molecular diagnosis. In addition, in conventional PCR testing, normal tissues must be used as a control to determine the microsatellite stability status of tumor tissues, while most NGS-MSI algorithms use a normal human length distribution model or construct a normal human microsatellite distribution baseline, so no need to use normal tissues as a control [4].
However, the coverage region varies among different targeted capture sequencing plans, and the sequencing method also varies. In this article, we will share specific illustrations to indicate three important factors that affect the stability of MSI testing:
-
Panel size
-
Paired samples and single samples
-
Sequencing method: different reads, platforms, and depths
Experimental Design
The two cases of paired samples include both normal tissue (normal/N) and tumor tissue (tumor/T), among which the tumor tissue sampleA-T is MSI-H, and sampleB-T is MSS. The NadPrep® DNA Library Preparation Module from Nanodigmbio is used to construct pre-libraries on MGI and Illumina platforms. Three panels of different sizes: whole-exon panel (L-panel), pan-cancer panel (M-panel) and the specific panel (S-panel) targeting dozens of genes are selected for sequencing after capture.
In this article, msisensor-pro [5] is used to analyze the stability status of microsatellites in different sequencing data, and the parameters are all default parameters.
Table 1. Panel information

Table 2. Capture test data

Note: The data of M-Panel on Illumina PE100 are intercepted from Illumina PE150.
Basic Performance
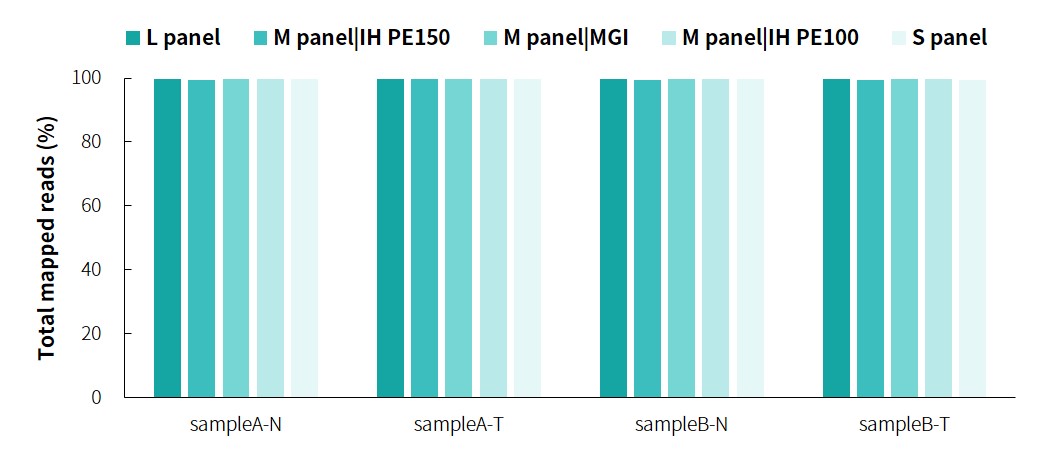
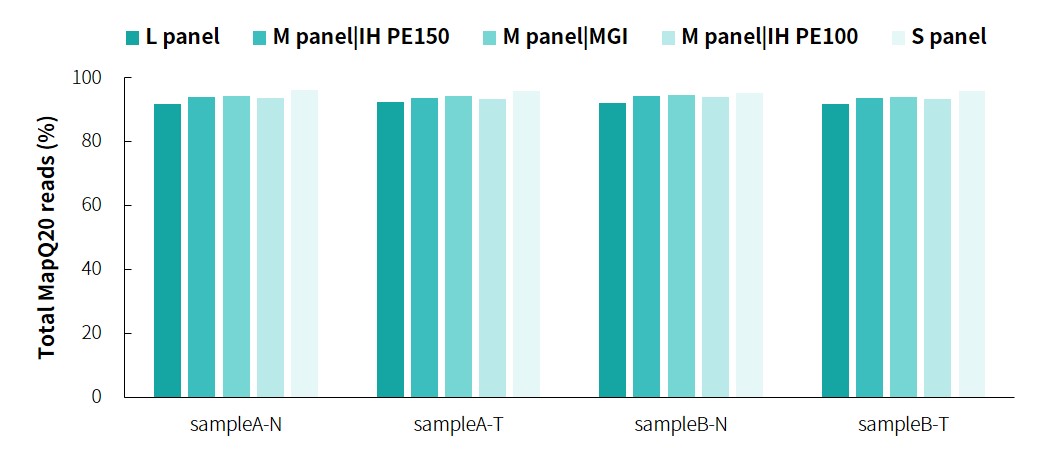
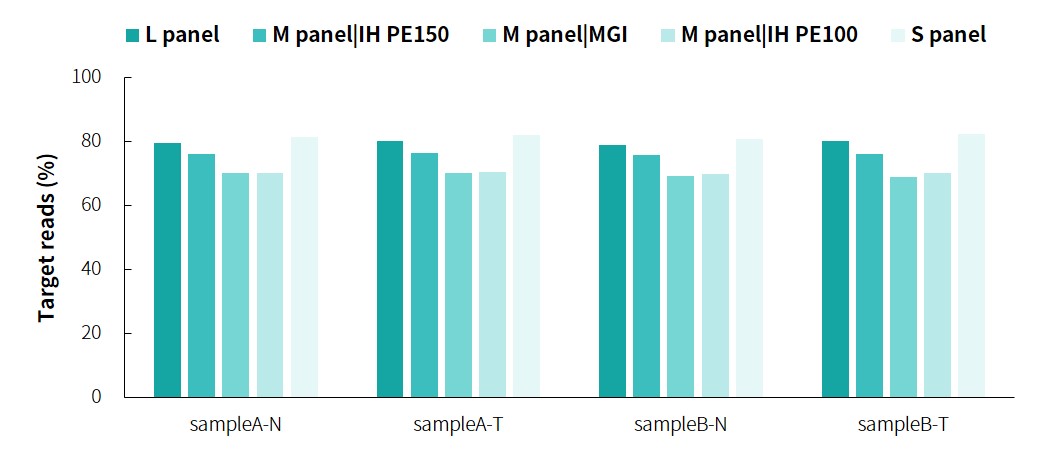
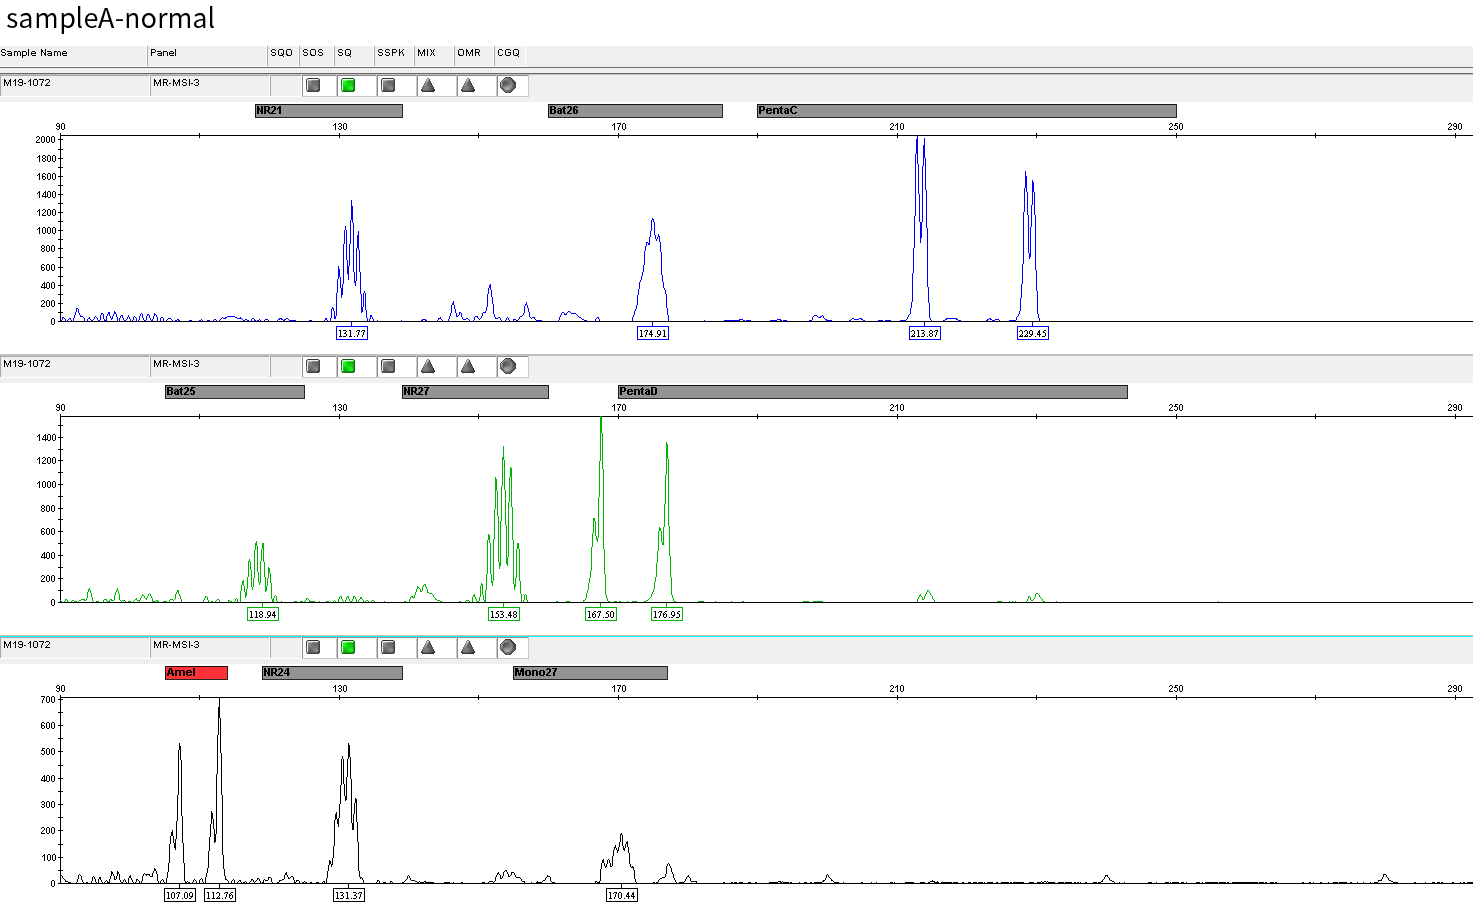
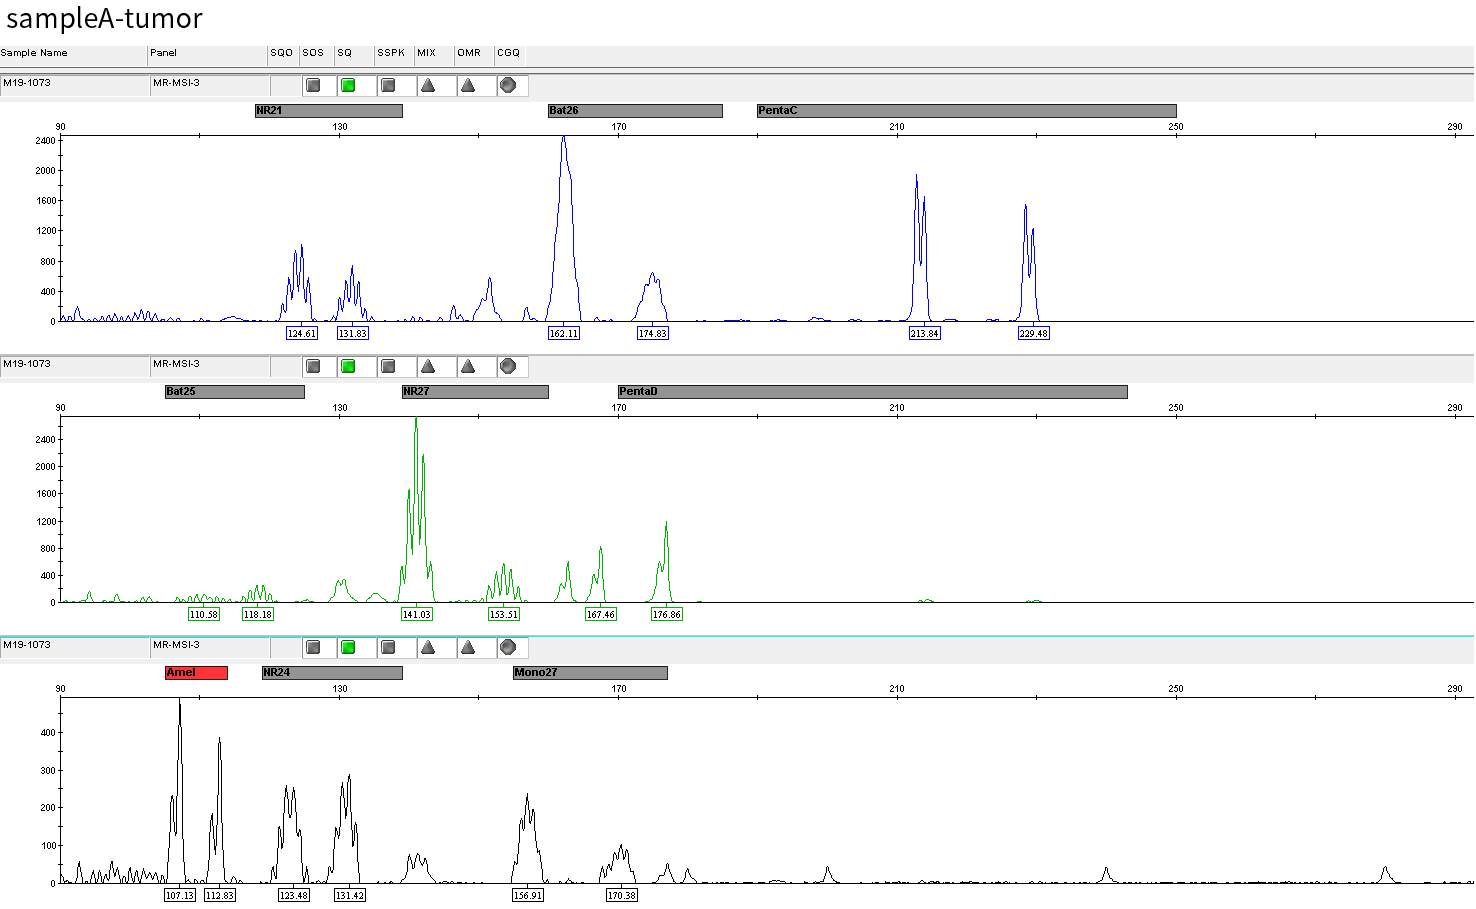
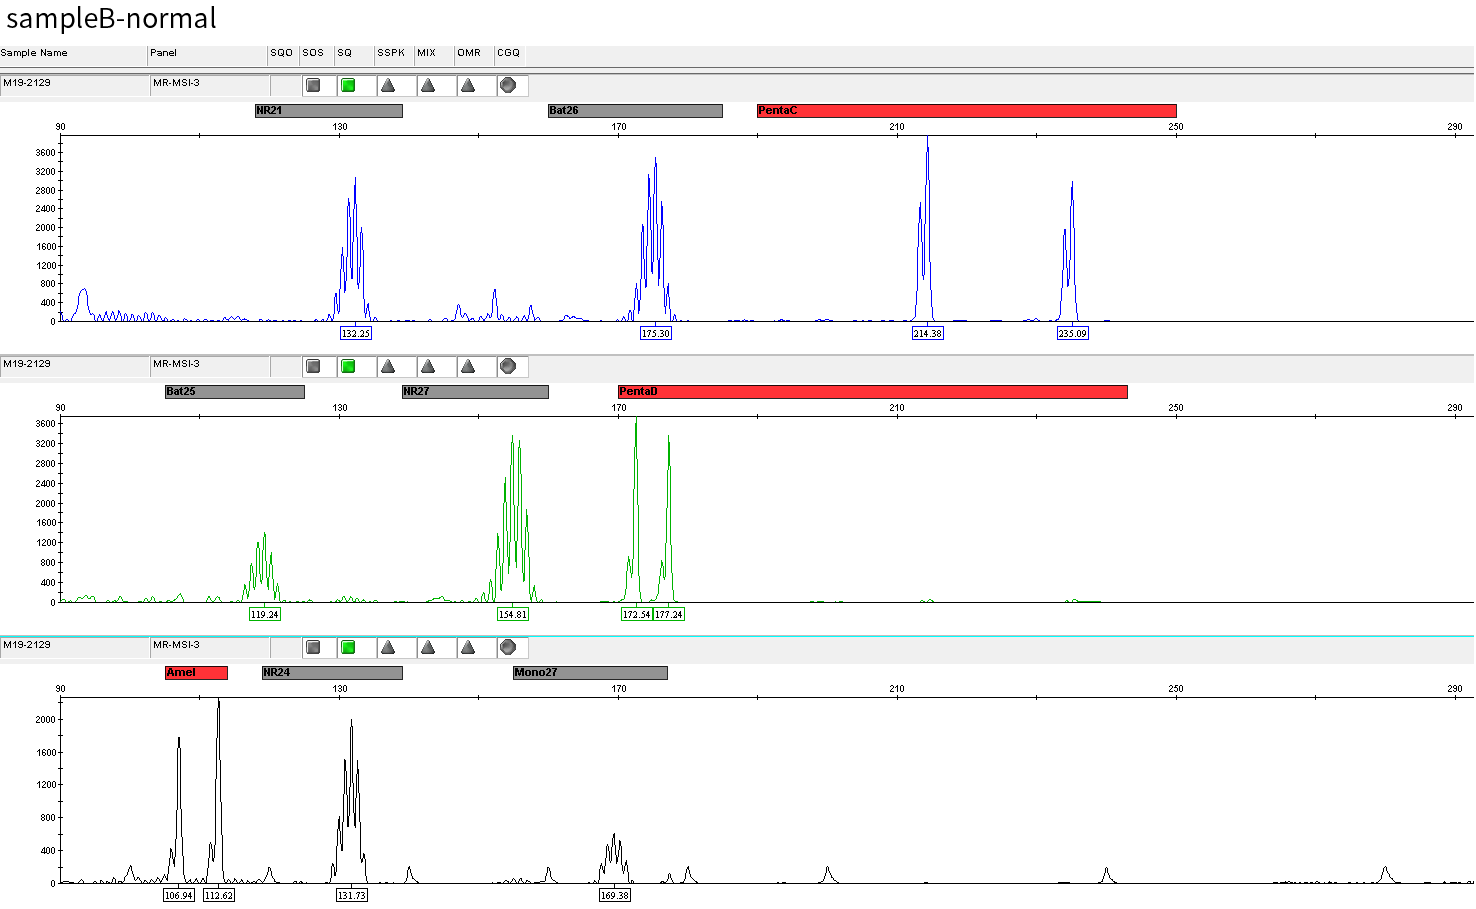
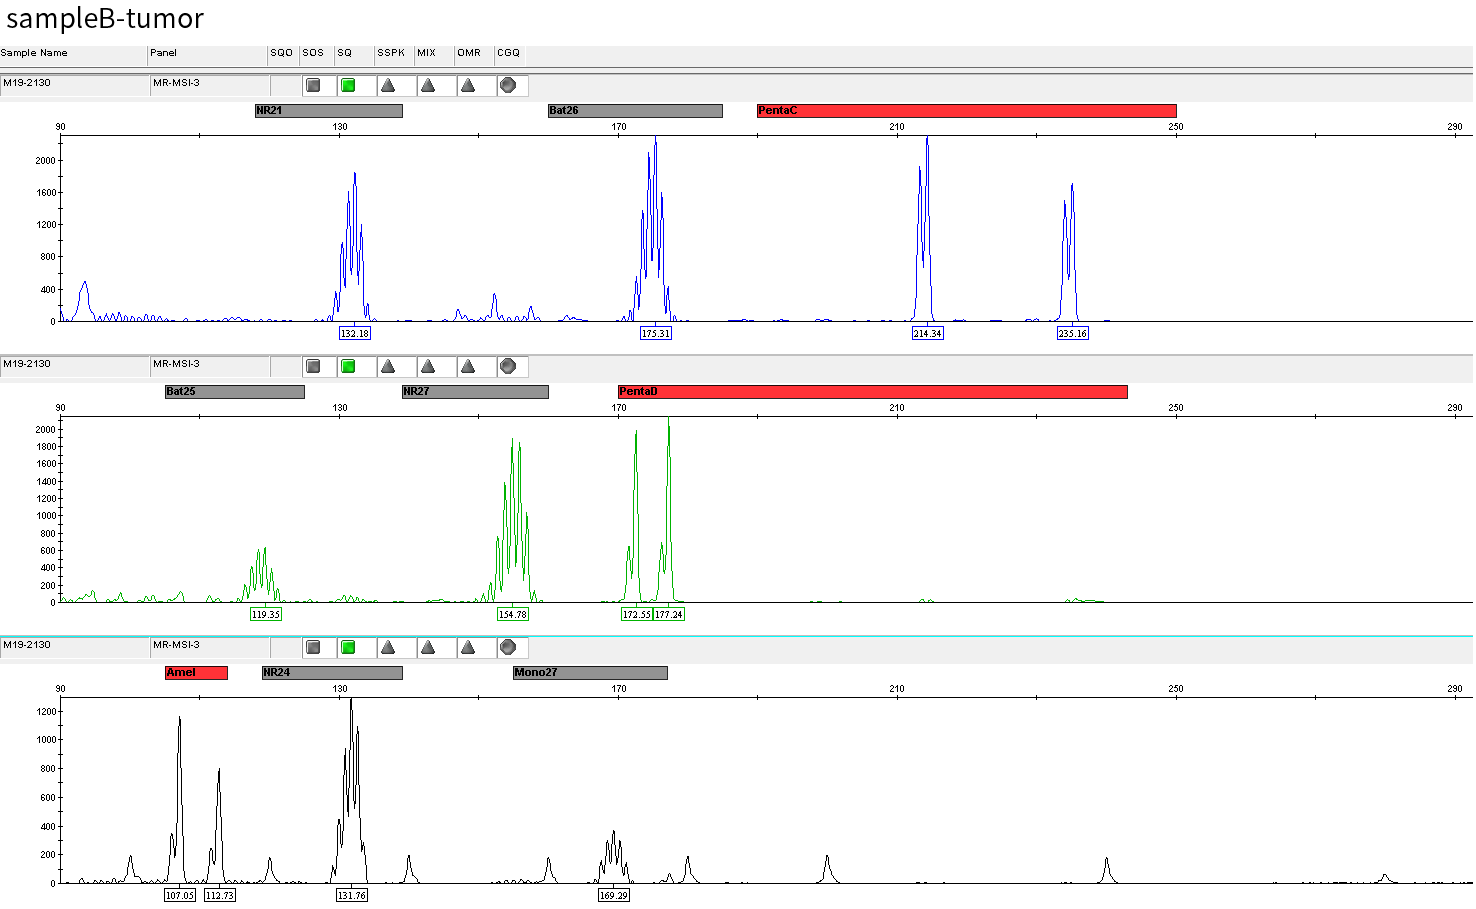
The specific information of comparison rate, MQ20 ratio, and on-target rate of sampleA and sampleB is shown in Figure 1. The data quality is relatively good and meets the analytical standards. In addition, the results of 9 microsatellites detected by PCR combined with capillary electrophoresis for sampleA and sampleB are shown in Figure 2. SampleA is MSI-H, and sampleB is MSS.
Swipe left and right to see more
Figure 1. Overall results of targeted capture of paired sampleA and sampleB.
Swipe left and right to see more
Figure 2. Paired sampleA and sampleB are MSI-H and MSS, respectively.
MSI Analysis
The msisensor-pro calculates the stability of each microsatellite site (MSI/MSS) in the sample that meets the analytical conditions. If the number of available microsatellite sites is x and the number of microsatellite sites evaluated as MSI is y, the MSI percentage of the sample, MSI% = (y/x) * 100%. MSI% usually needs to be compared with the threshold value before being used to judge the microsatellite stability status of the sample. The threshold value is established based on the support of data such as a certain amount of the samples and different populations, so the threshold division in this article is for reference only and does not represent actual application performance.
// Comparison of MSI Results under Different Conditions
Panel Size
It can be seen from Figure 3 that in the analysis of paired samples, although the MSI% values (27% to 37%) of sampleA (MSI-H) and sampleB (MSS) in three different sizes of panels show certain fluctuation, the results are similar and are maintained within their respective ranges. This means that it is feasible to establish threshold lines for three different sizes of panels after testing of a large amount of MSI/MSS samples.
Paired Samples and Single Samples
When comparing the paired and tumor-only analytical methods (Figure 3), the MSI% values of the MSS samples by tumor-only analysis all increase in varying degrees. In particular, the MSI% value of the MSS sample by S-Panel sequencing is already close to the MSI% value of the MSI-H sample by L-Panel sequencing. However, specific to each panel, the MSI% values of MSI-H and MSS samples are still significantly different. This means that when tumor-only analysis is performed, MSI and MSS samples can only be distinguished in a single panel, and it is not appropriate to directly compare the MSI thresholds among different panels.
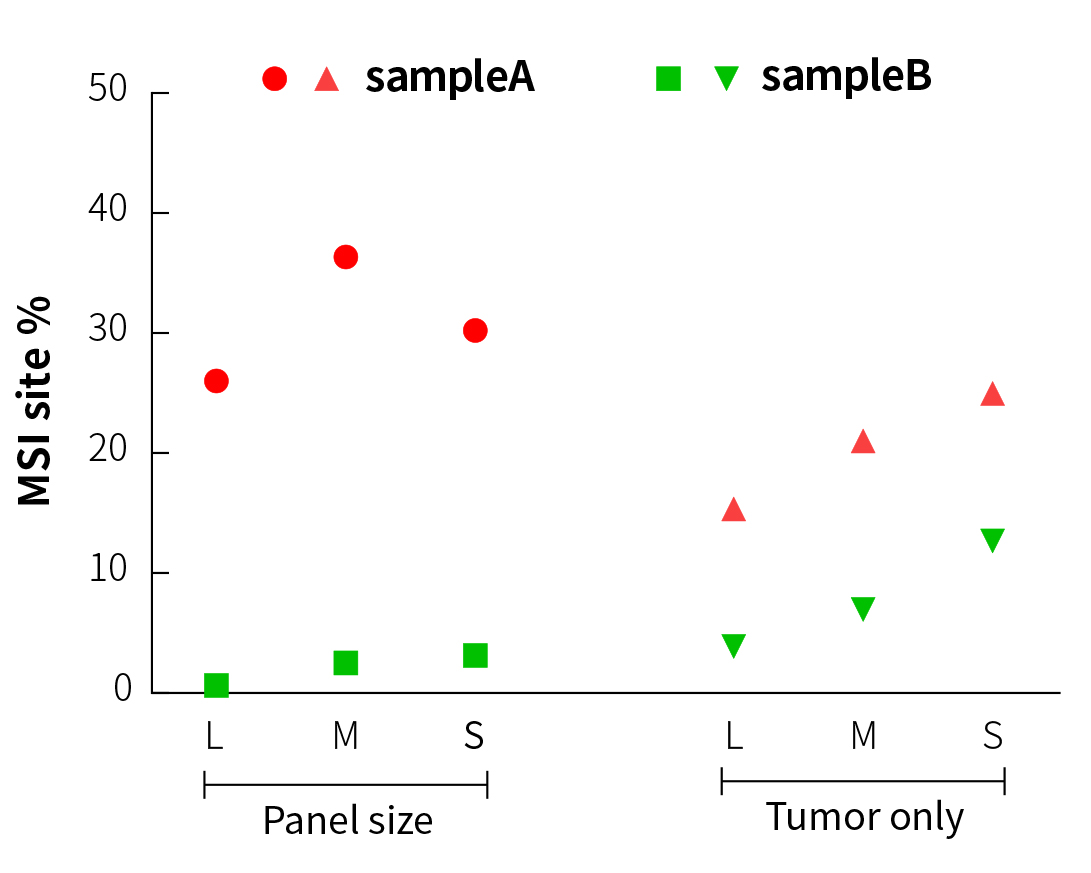
Figure 3. MSI testing results of different panels and analytical methods
Sequencing Method
In order to evaluate the effect of the sequencing platform and read length on MSI% values, we have compared and analyzed the results on the MGI and Illumina sequencing platforms after M-Panel capture. The analysis results of different sequencing platforms and read length modes (PE150 and PE100) are basically consistent, indicating that the different sequencing methodshave little effect on the MSI% of the samples, and the detected MSI sites are basically consistent (Figure 4).
Considering that the sequencing depth of whole-exon panel (L-Panel) is usually low, we have simulated and analyzed the MSI% detection of L-Panel at different sequencing depths. At this time, the MSI% increases as the sequencing depth increases, but the MSI% values of MSI-H and MSS samples have significant differences. The samples can still be well distinguished even if the average depth is as low as 50x (Figure 4).
The results of M-Panel are similar, and MSI-H and MSS can also be distinguished significantly.
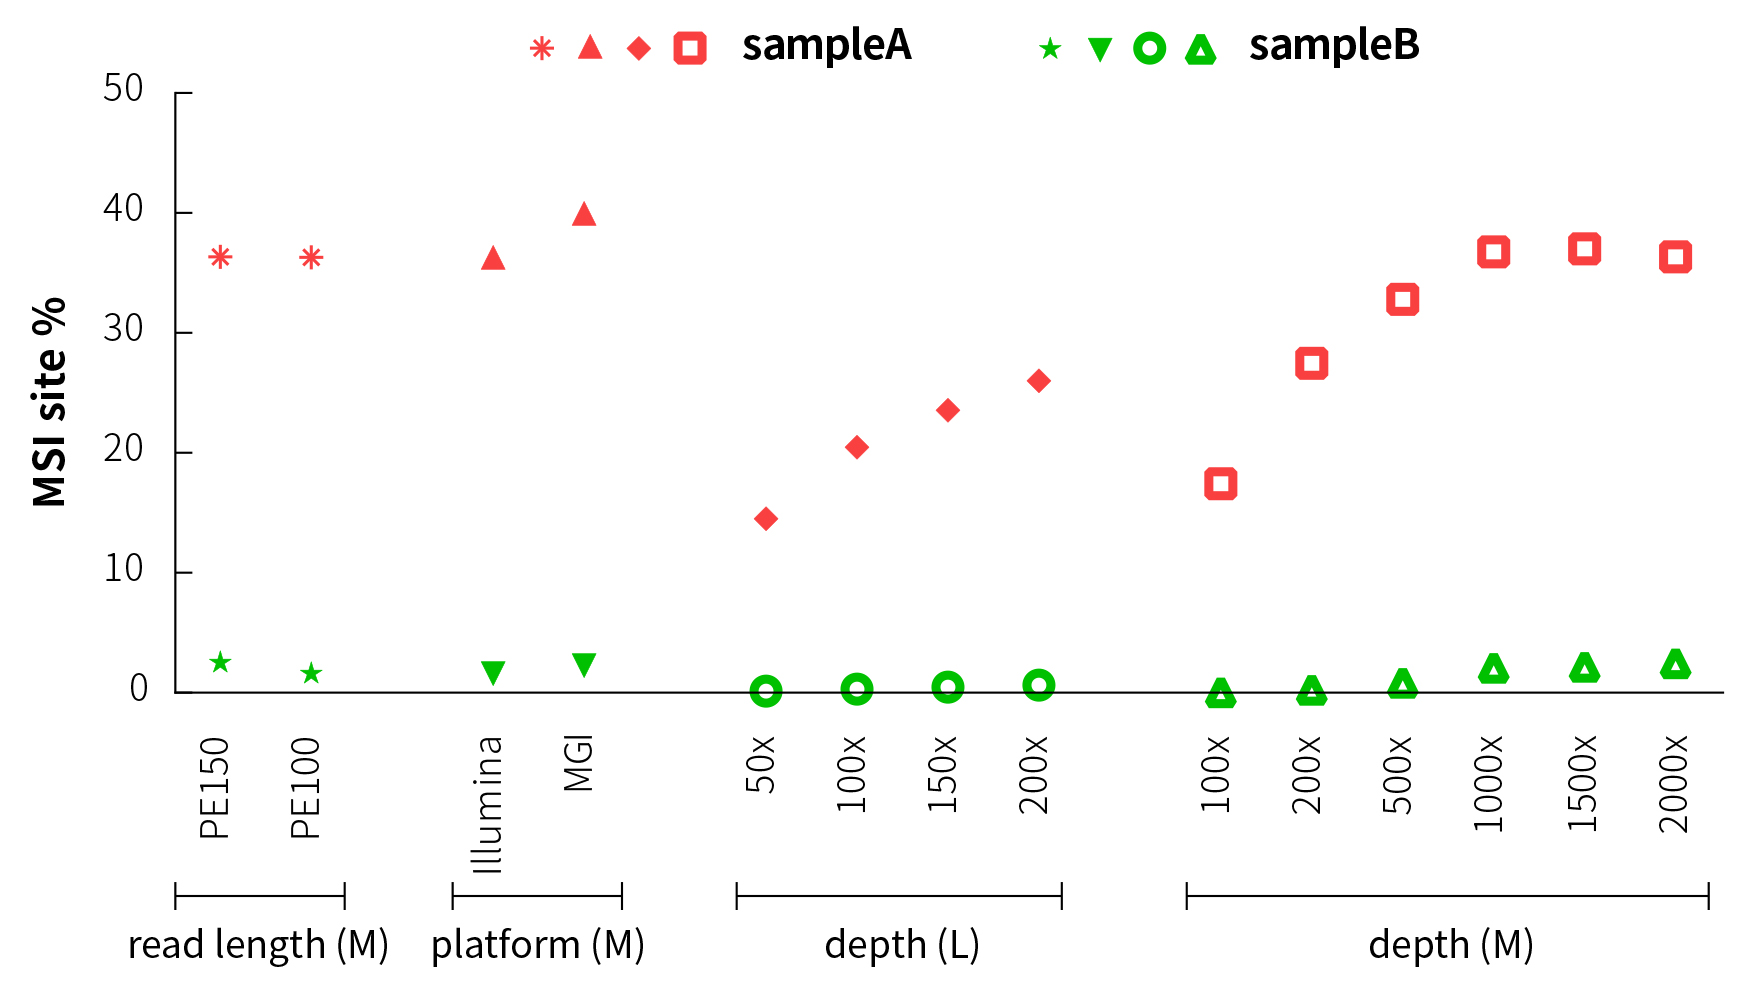
Figure 4. MSI detection results under different sequencing methods
// Distribution of MSI Sites under Different Conditions
The specific MSI distribution of the different samples above and analytical methods are shown in Figure 5. When paired samples are analyzed using L-Panel and M-Panel, the MSI sites detected in the MSI-H sample basically have an including relationship as the sequencing depth increases, that is, the MSI sites in the higher depth data include those in the lower depth data. The MSI sites detected by the tumor-only analytical method using L-Panel and the MSI sites detected by the paired analytical method are quite different, but they still have common MSI sites. When M-Panel is used for paired sample analysis, the MSI sites detected on the Illumina and MGI platforms are almost consistent, again indicating that the difference between the sequencing platforms is subtle.
It can be seen from sampleB of MSS that the tumor-only data of L-Panel and M-Panel judge some microsatellite sites to be unstable due to no control reference. Besides, there are barely no MSI sites under other conditions.
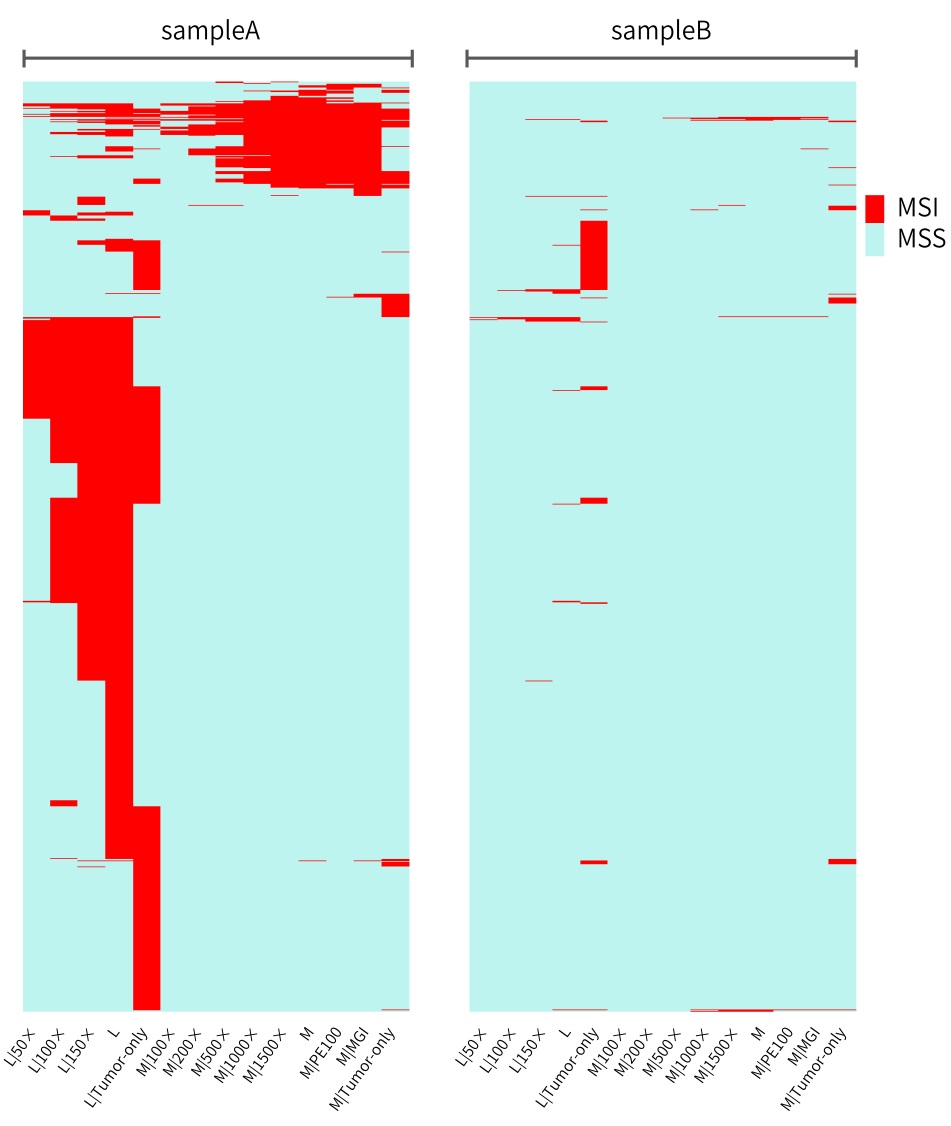
Figure 5. Different sequencing data of sampleA and sampleB to detect the distribution of MSI microsatellites using msisensor-pro
The abscissa represents the sequencing data of the two samples under different conditions, and the ordinate represents the MSI sites judged in any data (the MSS sites detected in all data are not shown).
// Detection of Typical Microsatellite Sites in NGS
Typical microsatellite sites have been added to the three panels. The microsatellite length distribution detected by NGS can be directly compared with the results by the gold-standard fluorescent multiplex PCR combined with capillary electrophoresis, which is favorable to the optimization of the NGS analysis process. As shown in Figure 6, taking L-panel as an example, the NGS results and the gold-standard capillary electrophoresis results of the MSI-H sampleA consistently show that BAT-25, BAT-26, MONO27, NR21, NR24, and NR27 have obvious deviations in the tumor sample, while the results of the MSS sampleB consistently show that the peaks of these 6 microsatellite sites are consistent with control.
sampleA
Swipe left and right to see more
sampleB
Swipe left and right to see more
Figure 6. Map of microsatellite length distribution at six microsatellite sites of tumor and normal samples of sampleA and sampleB
For the L-Panel targeted capture result, the abscissa represents the length of the microsatellite, and the ordinate represents the ratio of the number of reads after normalization of the tumor sample to the normal sample.
Summary
This article analyzes the sequencing data of the two MSI-H and MSS samples under different conditions, and compares them with those with capillary electrophoresis to indicate the effect of various factors on MSI testing in the NGS analysis. In general, a reasonable design of targeted capture plan, combined with paired sample analysis under a certain sequencing depth, can detect MSI stably. Targeted capture sequencing also has the following advantages: simultaneous detection of multiple genes and multiple targets, such as mutation, tumor mutation burden and copy number variation; when there is no normal tissue as the control, single sample analysis can also obtain good results; compared with the conventional 5-7 microsatellite sites, targeted capture sequencing can cover up to thousands of microsatellite sites, providing more reference information.
However, it should also be noted that there are still certain challenges in targeted capture sequencing. For example, identifying microsatellite sites that can be easily distinguished requires excellent algorithms and a large number of samples for verification; the capture and sequencing of microsatellite sequences are more difficult than that of general sequences; the library construction process, sequencing parameter calibration and bioinformatic analysis are more complicated and delicate [4]
Reference
[1] https://clinicaltrials.gov/ct2/show/NCT01876511
[2] Salipante S J, Scroggins S M, Hampel H L, et al. Microsatellite instability detection by next generation sequencing[J]. Clinical chemistry, 2014, 60(9): 1192-1199.
[3] Niu B, Ye K, Zhang Q, et al. MSIsensor: microsatellite instability detection using paired tumor-normal sequence data[J]. Bioinformatics, 2014, 30(7): 1015-1016.
[4] Advances in clinical oncology in China. Interpretation of the consensus of Chinese experts on microsatellite instability (MSI) detection of colorectal cancer and other related solid tumors[J]. 2019, 209-212.
[5] Jia P, Yang X, Guo L, et al. MSIsensor-pro: Fast, accurate, and Matched-normal-sample-free detection of microsatellite instability[J]. Genomics, proteomics & bioinformatics, 2020, 18(1): 65-71.
Solutions
- Methyl Library Preparation Total Solution
- Sequencing single library on different platform--Universal Stubby Adapter (UDI)
- HRD score Analysis
- Unique Dual Index for MGI platforms
- RNA-Cap Sequencing of Human Respiratory Viruses Including SARS-CoV-2
- Total Solution for RNA-Cap Sequencing
- Total Solution for MGI Platforms
- Whole Exome Sequencing
- Low-frequency Mutation Analysis
Events
-
Exhibition Preview | Nanodigmbio invites you to join us at Boston 2025 Annual Meeting of the American Society of Human Genetics (ASHG)

-
Exhibition Preview | Nanodigmbio Invites You to Join Us at WHX & WHX Labs Kuala Lumpur 2025, Malaysia International Trade and Exhibition Centre in Kuala Lumpur

-
Exhibition Preview | Nanodigmbio Invites You to Join Us at Hospitalar 2025, Brazil International Medical Device Exhibition in São Paulo

-
Exhibition Preview | Nanodigmbio invites you to join us at Denver 2024 Annual Meeting of the American Society of Human Genetics (ASHG)

-
Exhibition Preview | Nanodigmbio invites you to join us at Sapporo 2024 Annual Meeting of the Japan Society of Human Genetics (JSHG)

-
Exhibition Preview | Nanodigmbio invites you to join us at Association for Diagnostics & Laboratory Medicine (ADLM)


